
Blog / MyLead Guide
MyLead Statistics and Reports: Which 10 Reports Should You Use?
This article is updated regularly
Last update:
09 December 2025
The Statistics and reports section in MyLead gives publishers 10 dedicated reports that track visits, leads, conversion rate, earnings and EPC. Each report pairs a summary chart at the top with a detailed table below, covering performance by day, campaign, configuration, country, referral, smartlink, incent campaign and HideLink within a single panel.
This guide walks through all 10 MyLead reports, explains the metrics behind them, and shows which report answers which question about your affiliate campaigns.
What you'll learn from this article:
which 10 reports are available in the MyLead Statistics and reports menu,
what each report measures — visits, leads, conversion rate, earnings and EPC,
how to read EPC and conversion rate to optimise your campaigns,
where to track smartlinks, referrals, incent campaigns and HideLink traffic.
What is the Statistics and reports section in MyLead?
The Statistics and reports section is the analytics hub of the MyLead panel, grouping 10 reports under one menu. It records every visit, lead, conversion and payout tied to your affiliate links. Each report opens with a chart summarising visits, conversion, leads and earnings, followed by a sortable, exportable data table.
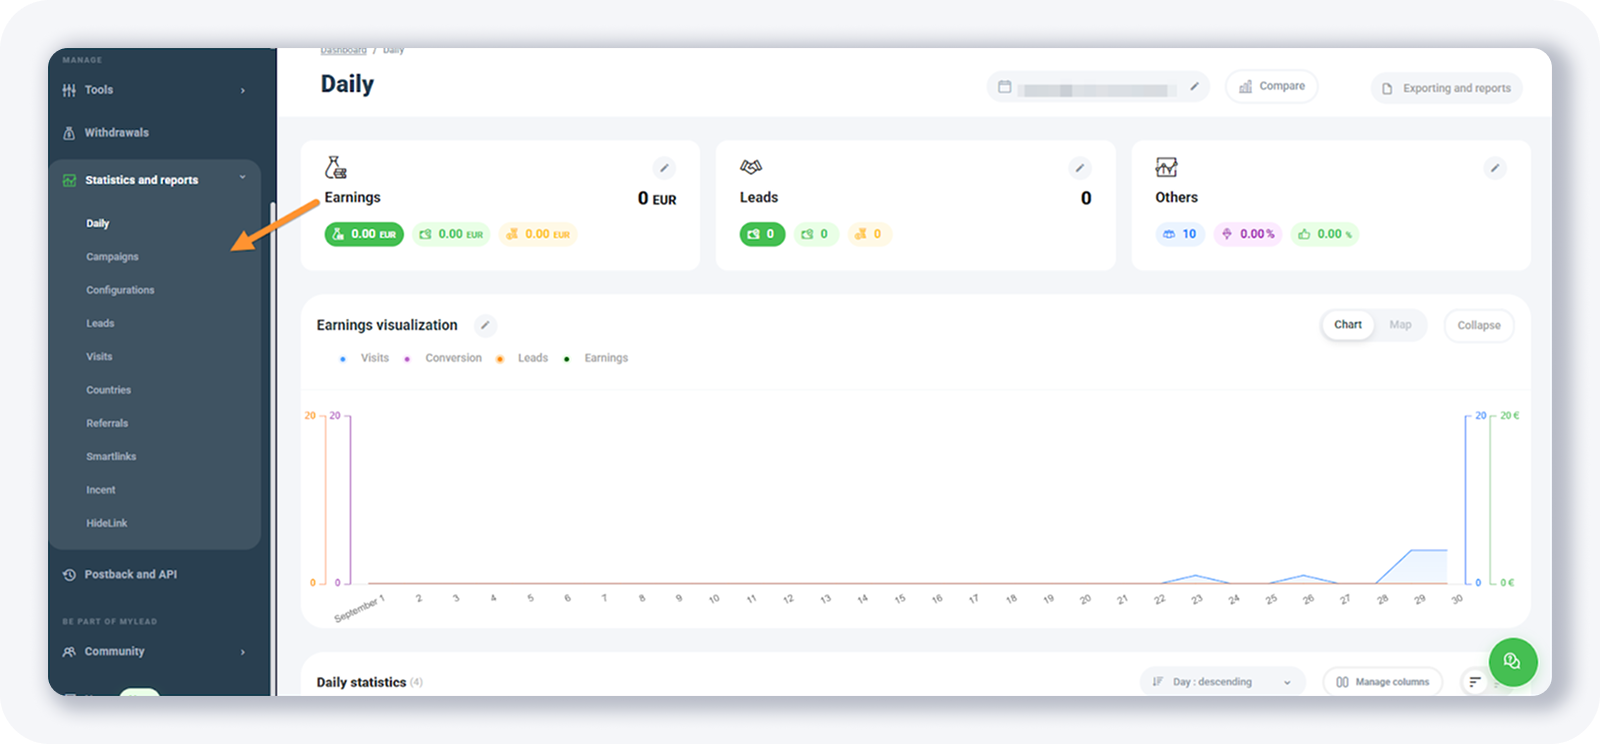
You reach it from the left sidebar of the MyLead dashboard, between Withdrawals and Postback and API. To feed accurate conversion data into these reports, configure your postback integration first.
Which 10 reports are available in MyLead?
MyLead provides 10 reports in the Statistics and reports menu: Daily, Campaigns, Configurations, Leads, Visits, Countries, Referrals, Smartlinks, Incent campaigns and HideLink. Most pair a performance chart with a table showing leads, earnings, visits, conversion rate and EPC, each sliced by a different dimension such as day, campaign or country.
Daily report — visits, leads, conversion rate and earnings in the top chart, plus a day-by-day table with leads, earnings, visits, conversion rate and EPC.
Campaigns report — the same metrics as the daily report, broken down per campaign instead of per day.
Configurations report — performance per campaign and per configuration it belongs to, such as a smartlink or an A/B test.
Leads report — a chart of your lead volume with a day-by-day table underneath.
Visits report — a live-visits view showing campaign name, configuration, visitor country, referrer and the date and time of each visit.
Countries report — leads, earnings, visits, conversion rate and EPC grouped by country.
Referrals report — the commission earned from referrals linked to your MyLead account.
Smartlinks report — leads, earnings, visits, conversion rate and EPC for each smartlink.
Incent campaigns report — statistics for any incentive campaigns you run.
HideLink report — statistics for links cloaked with the HideLink tool.
How do you read EPC and conversion rate in MyLead reports?
EPC (earnings per click) is your total earnings divided by the number of visits, showing how much each click is worth. Conversion rate is the share of visits that turn into leads. Both appear in most MyLead reports and reveal which campaigns, countries or smartlinks deserve more traffic and which to pause.
Compare EPC across the Countries and Smartlinks reports to spot your most profitable GEOs, then shift budget toward them. To go deeper, read our guide to the key affiliate metrics and analytics tools and learn how to set up a tracker for end-to-end attribution. Log in to your MyLead panel and open Statistics and reports to start optimising today.
Key takeaways
The MyLead Statistics and reports menu holds 10 reports covering every visit, lead, conversion and payout.
Most reports pair a chart with a table tracking leads, earnings, visits, conversion rate and EPC.
Use the Daily, Campaigns and Configurations reports to find which day, offer or A/B test performs best.
The Countries and Smartlinks reports reveal your most profitable GEOs and links by EPC.
The Referrals, Incent and HideLink reports track commissions, incentive campaigns and cloaked-link traffic separately.
Complete MyLead Guide - Chapter list
1. How to register on MyLead - click to read
2. Main Dashboard - click to read
3. My Profile - click to read
4. Offers (Affiliate Campaigns) - click to read
5. Surveys - click to read
6. OfferWall Rewards - click to read
7. Content Lockers - click to read
CPA Locker - click to read
Captcha Locker - click to read
File Locker - click to read
Mobile Rewards - click to read
Icent Campaigns - click to read
Offer API - click to read
8. Smartlniks - click to read
9. Free Affiliate Tools - click to read
Coupons and promotions - click to read
HideLink - click to read
Passage of Offers - click to read
Damaged Links - click to read
10. Withdrawals - click to read
11. Statistics and Reports - now reading
12. Postbacks - click to read
13. Adding MyLead as an Affiliate Network to your Tracker - click to read
14. How to Add MyLead Offers to the Tracker - click to read
15. How to Add MyLead Lockers (as an Offer) to Tracker - click to read
16. How to Add MyLead Smartlinks (as an Offer) to Tracker - click to read
17. Community and News - click to read
FAQ
1. How many reports are in the MyLead Statistics and reports section?
Ten reports: Daily, Campaigns, Configurations, Leads, Visits, Countries, Referrals, Smartlinks, Incent campaigns and HideLink.
2. What is EPC in the MyLead reports?
EPC (earnings per click) is your total earnings divided by the number of visits. It shows how much each click is worth and helps you compare campaign profitability.
3. Where can I see statistics for a single smartlink?
Open the Smartlinks report. It lists leads, earnings, visits, conversion rate and EPC for each smartlink you have created.
4. Can I track referral commissions in the reports?
Yes. The Referrals report shows the commission earned from referrals linked to your MyLead account.
Summary
The MyLead Statistics and reports section turns raw campaign activity into 10 focused reports, from daily performance to per-smartlink EPC. Master the metrics behind them — conversion rate and EPC above all — and you can quickly see which campaigns, countries and tools to scale and which to cut.
Have any questions? Feel free to reach us through our channels.